PPO Plans Reveals a Nonsensical Choice for All
If you're deciding between Caltech-offered staff PPO plans, the PPO 1800 planis likely to cost you - and Caltech - significantly more for the exact same coverage.
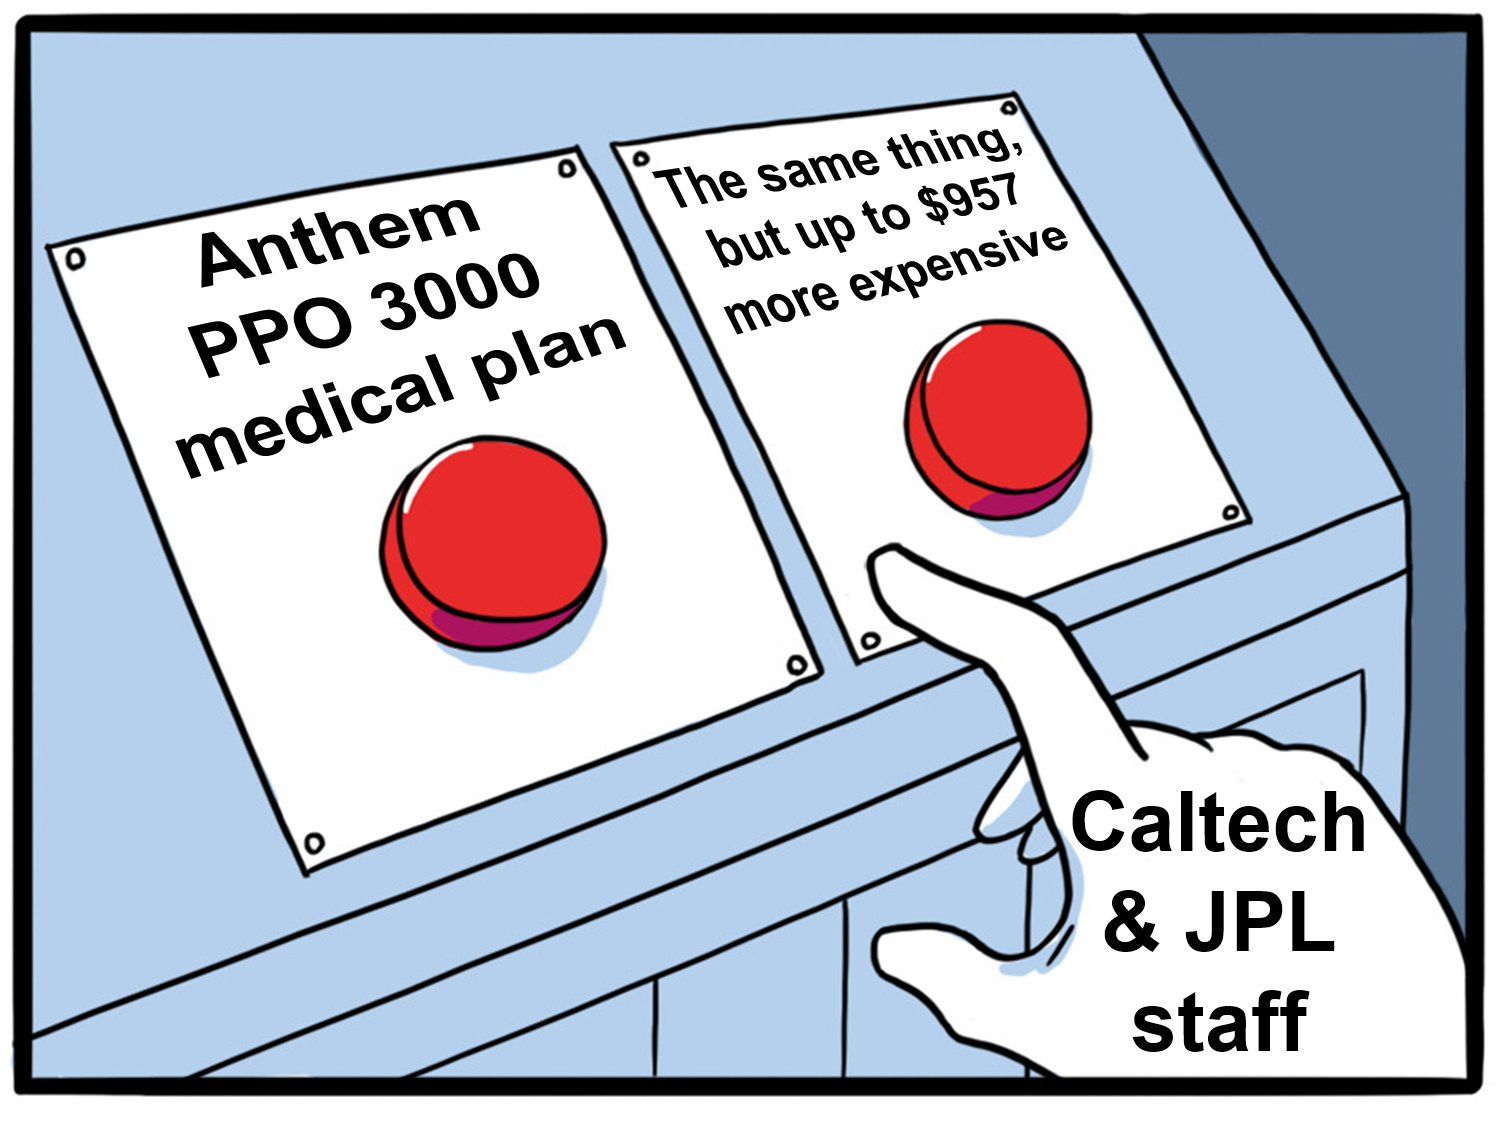
Which PPO plan will you choose?
By A. Sina Booeshaghi and Hesham M. Zaini
October 20, 2022
Link to one-page summary document (pdf)
A direct cost comparison of two PPO health insurance plans for Caltech and JPL staff reveals that one plan imposes a yearly financial penalty over the other for both Caltech ($1,865.28 per enrollee) and its employees (up to $957). This comparison reveals a pernicious cost extraction mechanism concealed as an illusion of choice by Anthem, which covered only 45% of charged claims in 2021.
Open enrollment for Caltech-offered health insurance starts on October 11 and ends on November 1. By the end of this three-week period, Caltech and JPL staff (postdocs, faculty, administrators, janitors, etc.) are tasked with understanding and selecting one of the four medical health insurance plans offered through Caltech; note that staff members who have already selected a plan can modify their selection until the end of this period. Three plans are provided by Anthem and one by Kaiser, Table 1. Selecting one of these plans requires comparing the various costs, requirements, and covered services - a task further complicated by esoteric vocabulary, variability in covered services, and cost structures.
Table 1: Health insurance plans. The individual yearly premium, deductible, and out-of-pocket maximum for four plans offered by Caltech. Coverage is the fraction of cost taken on by insurance, past the deductible, and up to the out-of-pocket maximum (OOPM). All plans cover 100% of cost for covered services after the OOPM. This table was created by compiling costs from each plans benefits summary. PPO coverage has some exceptions such as preventative care and prescription drugs, and HMO coverage is service dependent.
|
Plan name |
Premium |
Deductible |
Coverage |
OOPM |
OOPM + Premium |
|
Anthem PPO 1800 |
$1,860 |
$1,800 |
In: 80% Out: 60%.. |
$4,000 |
$5,860 |
|
Anthem PPO 3000 |
$648 |
$3,000 |
In: 80% Out: 60%.. |
$4,000 |
$4,648 |
|
Anthem HMO |
$2,076 |
0 |
service dependent |
$1,500 |
$3,576 |
|
Kaiser HMO |
$1,860 |
0 |
service dependent |
$1,500 |
$3,360 |
One important distinction between these four plans is their type. Health Maintenance Organization (HMO) plans require enrollees to have a primary care provider and to get specialist referrals for special health issues, whereas Preferred Provider Organization (PPO) plans do not. Additionally, enrollees who hold a J-1 visa are restricted to HMO plans only. While comparing HMO plans to PPO plans is like comparing apples to oranges, the two Caltech-offered PPO plans offer identical coverage and can therefore be compared directly on the basis of cost alone.
The Caltech Benefits office has numerous web pages that include plan documents,a summary of plan benefits, and a cost estimator tool offered through https://mybenefits.caltech.edu/ that does not account for tax-deduction savings from premiums. The "Guide to the High Deductible PPOs" provides details on PPO plan coinsurance and health savings accounts (HSAs), but the only contrast made between the costs of the two PPO plans is between their deductibles. Additionally, the "Tips for Selecting Medical Plan" document appears to be the only resource that suggests including the cost of premiums in a cost analysis, offering an oversimplified equation for calculating health care costs that can be misleading. This seems to be the standard comparison drawn between PPO plans, namely that plans typically offer either low deductibles with high premiums, or high deductibles with low premiums. However, as we will show in the case of the Caltech-offered PPO plans, the low deductible plan is always more expensive. To understand why, we must first understand health insurance cost structures for these plans.
Healthcare cost is determined by four dollar amounts: the premium, deductible, out-of-pocket maximum (OOPM), and cumulative amount billed by service providers (which resets yearly), as illustrated in Figure 1. The premium is a fee that is paid monthly to be enrolled in a health insurance plan. The deductible is the amount of money that an enrollee would need to spend, beyond the premium, before the health insurance company would start to share the cost burden. The OOPM is the absolute maximum that an enrollee would be required to pay in any one year, beyond the premium, for health insurance (for covered services).
Medical expenditure for PPO plans an be broken up into four regimes:
The costs that an enrollee is expected to pay under a given PPO plan depends on their medical expenditure. Since it is difficult to predict the exact medical services an enrollee will require over the course of a year, the cost to an enrollee (y-axis) of a given plan is plotted as a function of medical expenditure (x-axis) over the course of a year, Figure 1.
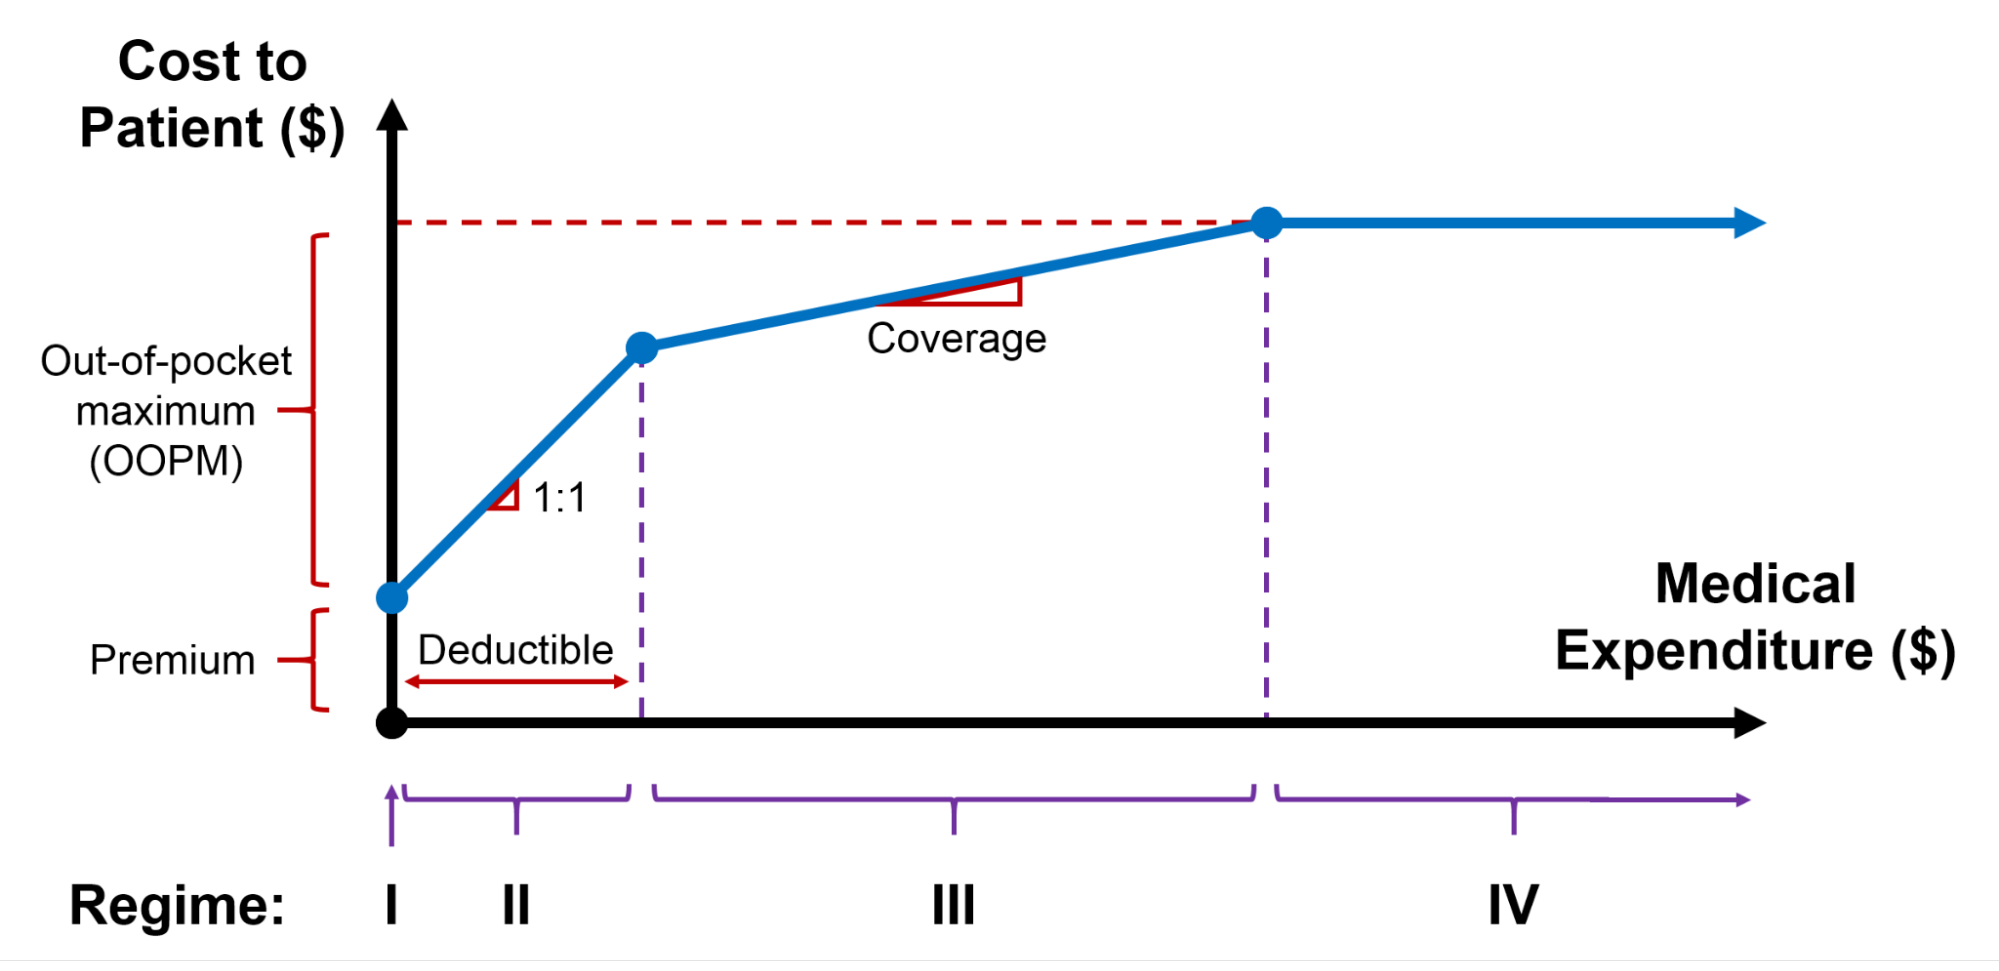
Figure 1: Healthcare costs for PPO plans. The cumulative cost a consumer is expected to pay (y-axis) for a given cost of healthcare as billed by service providers to the insurance company (x-axis). Cost to consumer for a given value of medical expenditure is determined by the premium, deductible, coverage, and out-of-pocket maximum (OOPM).
For example, a healthy staff member who uses no medical services would only pay for their healthcare premium (Regime I). An extremely sick staff member's charges beyond the premium could not exceed the OOPM (Regime IV).
Caltech offers a simple equation for comparing the two PPO plans: add the premium and deductible to determine your healthcare costs, as the "Tips for Selecting a Medical Plan" document suggests. PPO 1800 has a $1,860 premium and a $1,800 deductible, so an enrollee would need to spend $3,660 before insurance starts to kick in (red star, Figure 2a). On the other hand, PPO 3000 has a $648 premium and a $3,000 deductible, meaning $3,648 before insurance kicks in (blue star, Figure 2a). Simply adding the premium and deductible shows PPO 3000 to be less expensive despite the higher deductible, though this may not necessarily be the case. In 2022 for example, the two PPO plans had different premiums and deductibles that led to the PPO 3000-equivalent plan appearing more expensive by this heuristic, despite actually being less expensive. This is due to the different medical expenditures (x-axis) associated with the different deductibles (stars) that make comparing plans on the basis of premiums and deductibles potentially misleading.
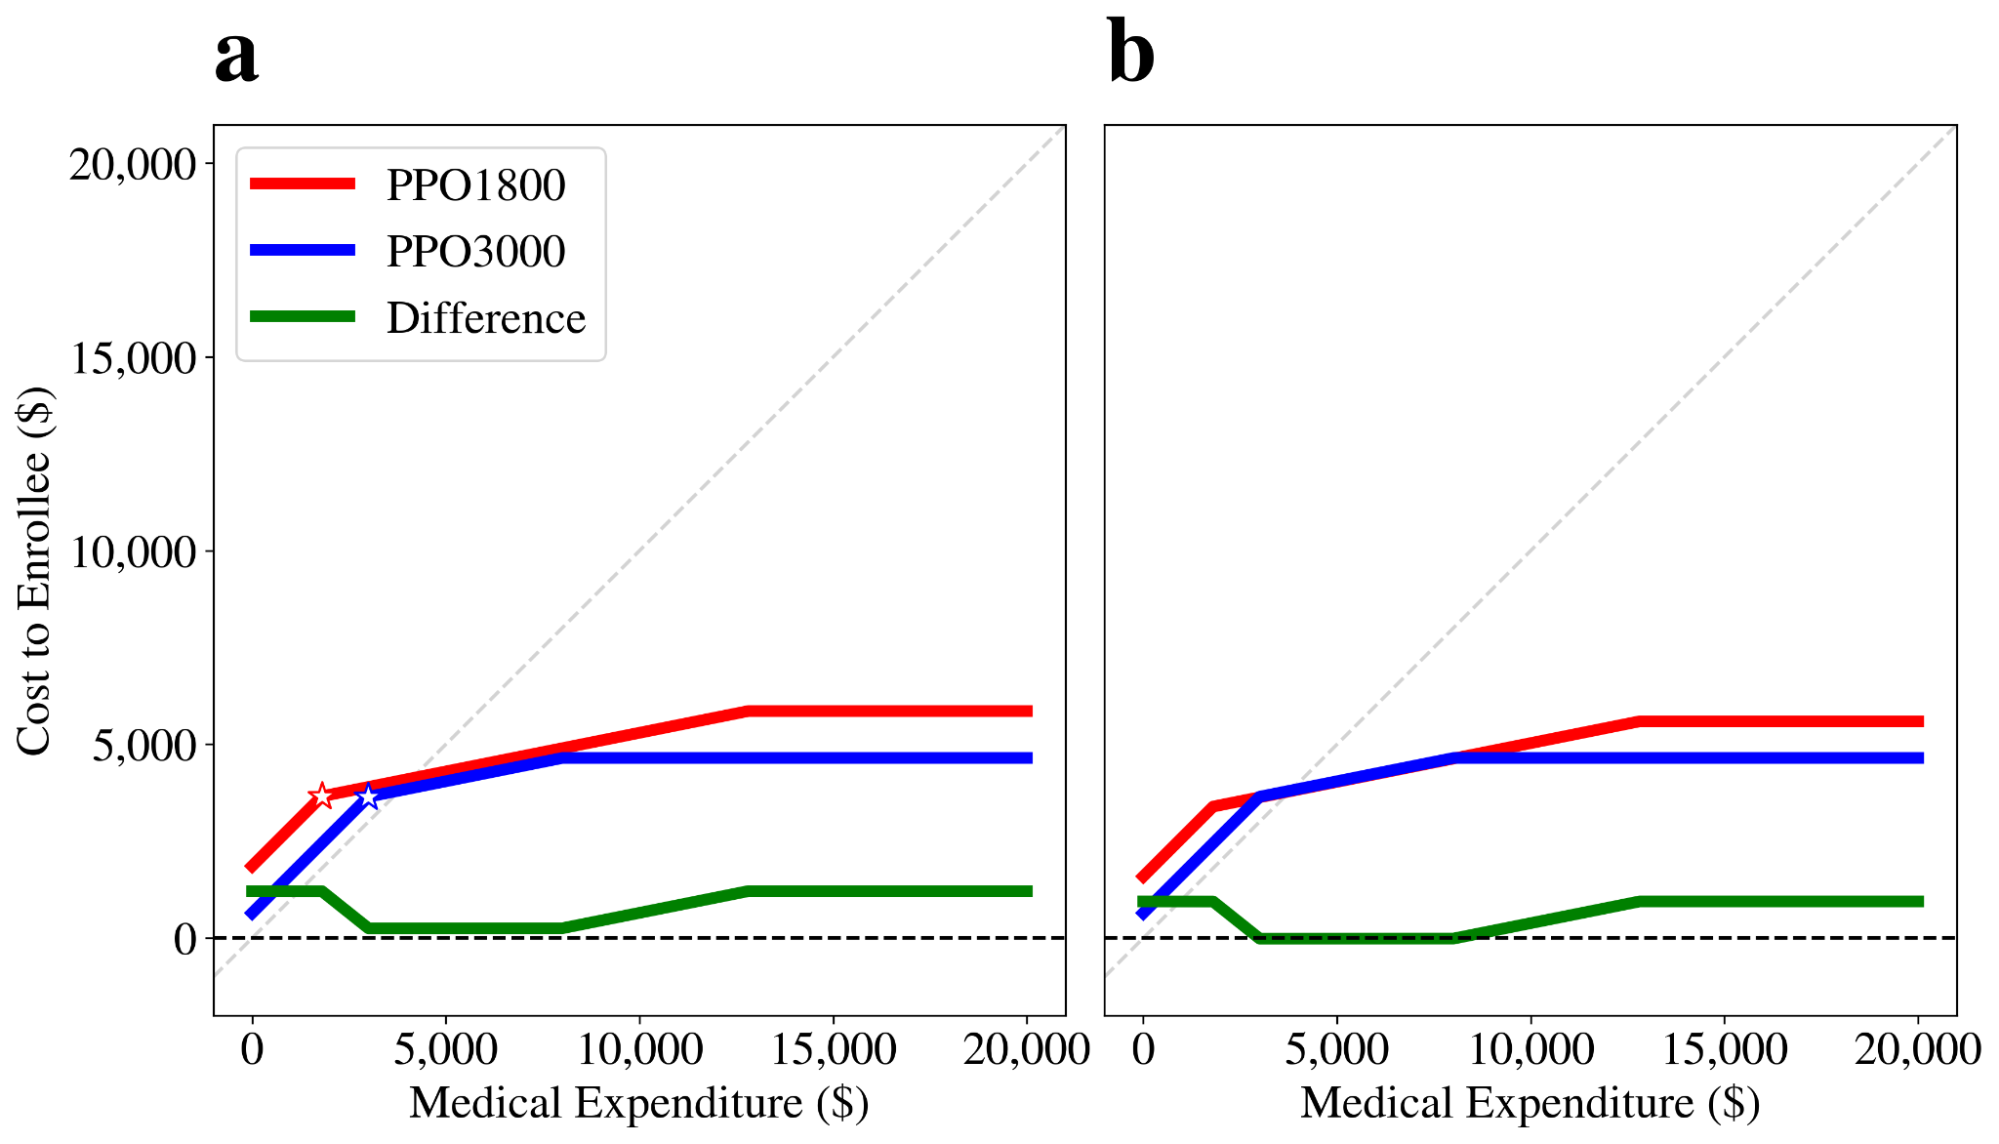
Figure 2: Healthcare costs for PPO plans. The cumulative cost an enrollee is expected to pay for a given cost of healthcare as billed by service providers to Anthem (a) without considering tax savings, and (b) including tax-deductible-normalized premiums for a postdoc salary. Before tax savings are considered for each plan, the point at which insurance companies begin to share costs is marked with a star.
A true apples to apples comparison corresponds to the vertical cost difference (y-axis) between the red and blue profiles for a given value of medical expenditure (x-axis) on Figure 2a. Such an analysis finds that a staff member would expect to save up to $1,212, but at least $252, with the lower premium plan (PPO 3000). The results of these cost comparisons and trends are consistent with those performed using online calculators, as well as online visualization toolsthat generate plots similar to those above. The Caltech cost-estimator toolenables Caltech staff to estimate their expected healthcare costs by inputting values for five different categories: emergency room visits, outpatient procedures, inpatient hospital procedures, doctor office visits, and prescription drugs. Based on these inputs, the tool will calculate the estimated annual cost for an enrollee. Cost estimates by the tool were found to be consistent with estimates for all regimes presented in Figure 2a, which do not account for tax savings based on the tax-deductible nature of premiums. The only tax-deduction setting that the tool offers is a cost-comparison that accounts for contributions to a health savings account (HSA), an optional tax-deductible account for managing health costs. Even with the maximum contribution to an HSA, the cost differences between the two plans remain consistent.
These cost comparisons, while improved, do not account for the fact that premiums are taken directly from pre-tax income, essentially making them tax-deductible. For example, if a postdoc made the minimum allowable postdoc salary of $64,480 per year and her premium was $1,000 per year, then her taxable income would be $63,480 and the amount of taxes she would owe is $9,582.26 ($220 less than taxes owed on $64,480). When taking taxes into account, a higher-premium health insurance plan could save an individual money due to a reduction in taxable income.
A true cost comparison therefore requires consideration of this tax-savings. The higher premium plan would save $266.64 more than the lower premium plan, based on the taxes paid on postdoc income. Using this amount, the higher premium plan (PPO 1800) is "normalized" by subtracting out the difference in the amount saved by taxes between the two plans (Figure 2c). Interestingly, if health costs are below $2,982 or above $8,073, then the lower premium plan would be less expensive than the higher premium plan, and a postdoc would save up to $945.36. However, if health costs for the year fall in between $2,982 and $8,073, a postdoc would spend up to $14.64 more for the lower premium plan.
Computing the average minimum and maximum cost savings with PPO 3000 for each tax bracket reveals that the maximum savings with PPO 3000 is always higher than the maximum savings with PPO 1800 across all income ranges, Table 2. For simplicity, it is assumed that deductions are entirely taxed within a single bracket.
Table 2: PPO 3000 savings. Average minimum and maximum cost savings across federal income brackets (tax year 2022) for PPO 3000 plan relative to PPO 1800 plan (and 2022 equivalent plans). A positive value indicates money saved, whereas a negative value indicates money lost.
|
|
|
2022 Savings(PPO 2800 over PPO 1600) |
2023 Savings(PPO 3000 over PPO 1800) |
||
|
Income range |
Tax |
Minimum |
Maximum |
Minimum |
Maximum |
|
0 - $10,275 |
10% |
$62 |
$1,022 |
$150 |
$1110 |
|
$10,276 - $41,775 |
12% |
$24 |
$984 |
$109 |
$1069 |
|
$41,776 - $89,075 |
22% |
-$78 |
$882 |
-$3 |
$957 |
|
$89,076 - $170,050 |
24% |
-$110 |
$850 |
-$36 |
$924 |
|
$170,051 - $215,950 |
32% |
-$192 |
$768 |
-$126 |
$834 |
|
$215,951 - $539,900 |
35% |
-$231 |
$729 |
-$169 |
$791 |
|
$539,901+ |
37% |
-$255 |
$705 |
-$194 |
$766 |
The potential savings always outweigh the potential costs, even with the savings decrease at higher income brackets due to higher marginal tax rates. Note that the potential savings are even higher in 2023 than in 2022.
Premiums paid by Caltech staff are a small fraction of the total cost for each healthcare plan due to Caltech subsidies. The share of each plan covered by Caltech is presented in Table 3.
Table 3: Subsidies to healthcare plan premiums. Shares of annual premiums paid by enrollees and by Caltech . Data were compiled from the Caltech healthcare enrollment portal.
|
Plan name |
Enrollee share of premium |
Caltech share of premium |
Premium Total |
|
Anthem PPO 1800 |
$1,860 |
$10,478.88 (84.9%) |
$12,338.88 |
|
Anthem PPO 3000 |
$648 |
$8,613.60 (93.0%) |
$9,261.60 |
|
Anthem HMO |
$2,076 |
$6,738.00 (76.4%) |
$8,814.00 |
|
Kaiser HMO |
$1,860 |
$5,036.16 (73.0%) |
$6,896.16 |
For each enrollee, Caltech subsidizes $10,478.88 of the PPO 1800 plan premium, and $8,613.60 of the PPO 3000 plan premium annually. This means that Caltech pays Anthem an extra $1,865.28 annually for each staff member who chooses the PPO 1800 plan over the PPO 3000 plan. So when a postdoc chooses the PPO 3000 plan over the PPO 1800 plan, they could save themselves up to $957 annually, and they save Caltech $1,865.28 annually.
Why is one PPO plan subsidized more than the other, when both offer identical coverage? According to a Caltech HR representative,
"They're [Caltech] offsetting more of the cost for this one [PPO 1800], otherwise they [enrollees] wouldn't want to elect it."
In other words, the purpose of the unequal subsidies is to incentivize Caltech employees to choose the more expensive plan. Whereas Figure 2a shows pre-tax PPO plan costs to only enrollees, the true pre-tax costs of the PPO plans to both enrollees and Caltech are illustrated in Figure 3.
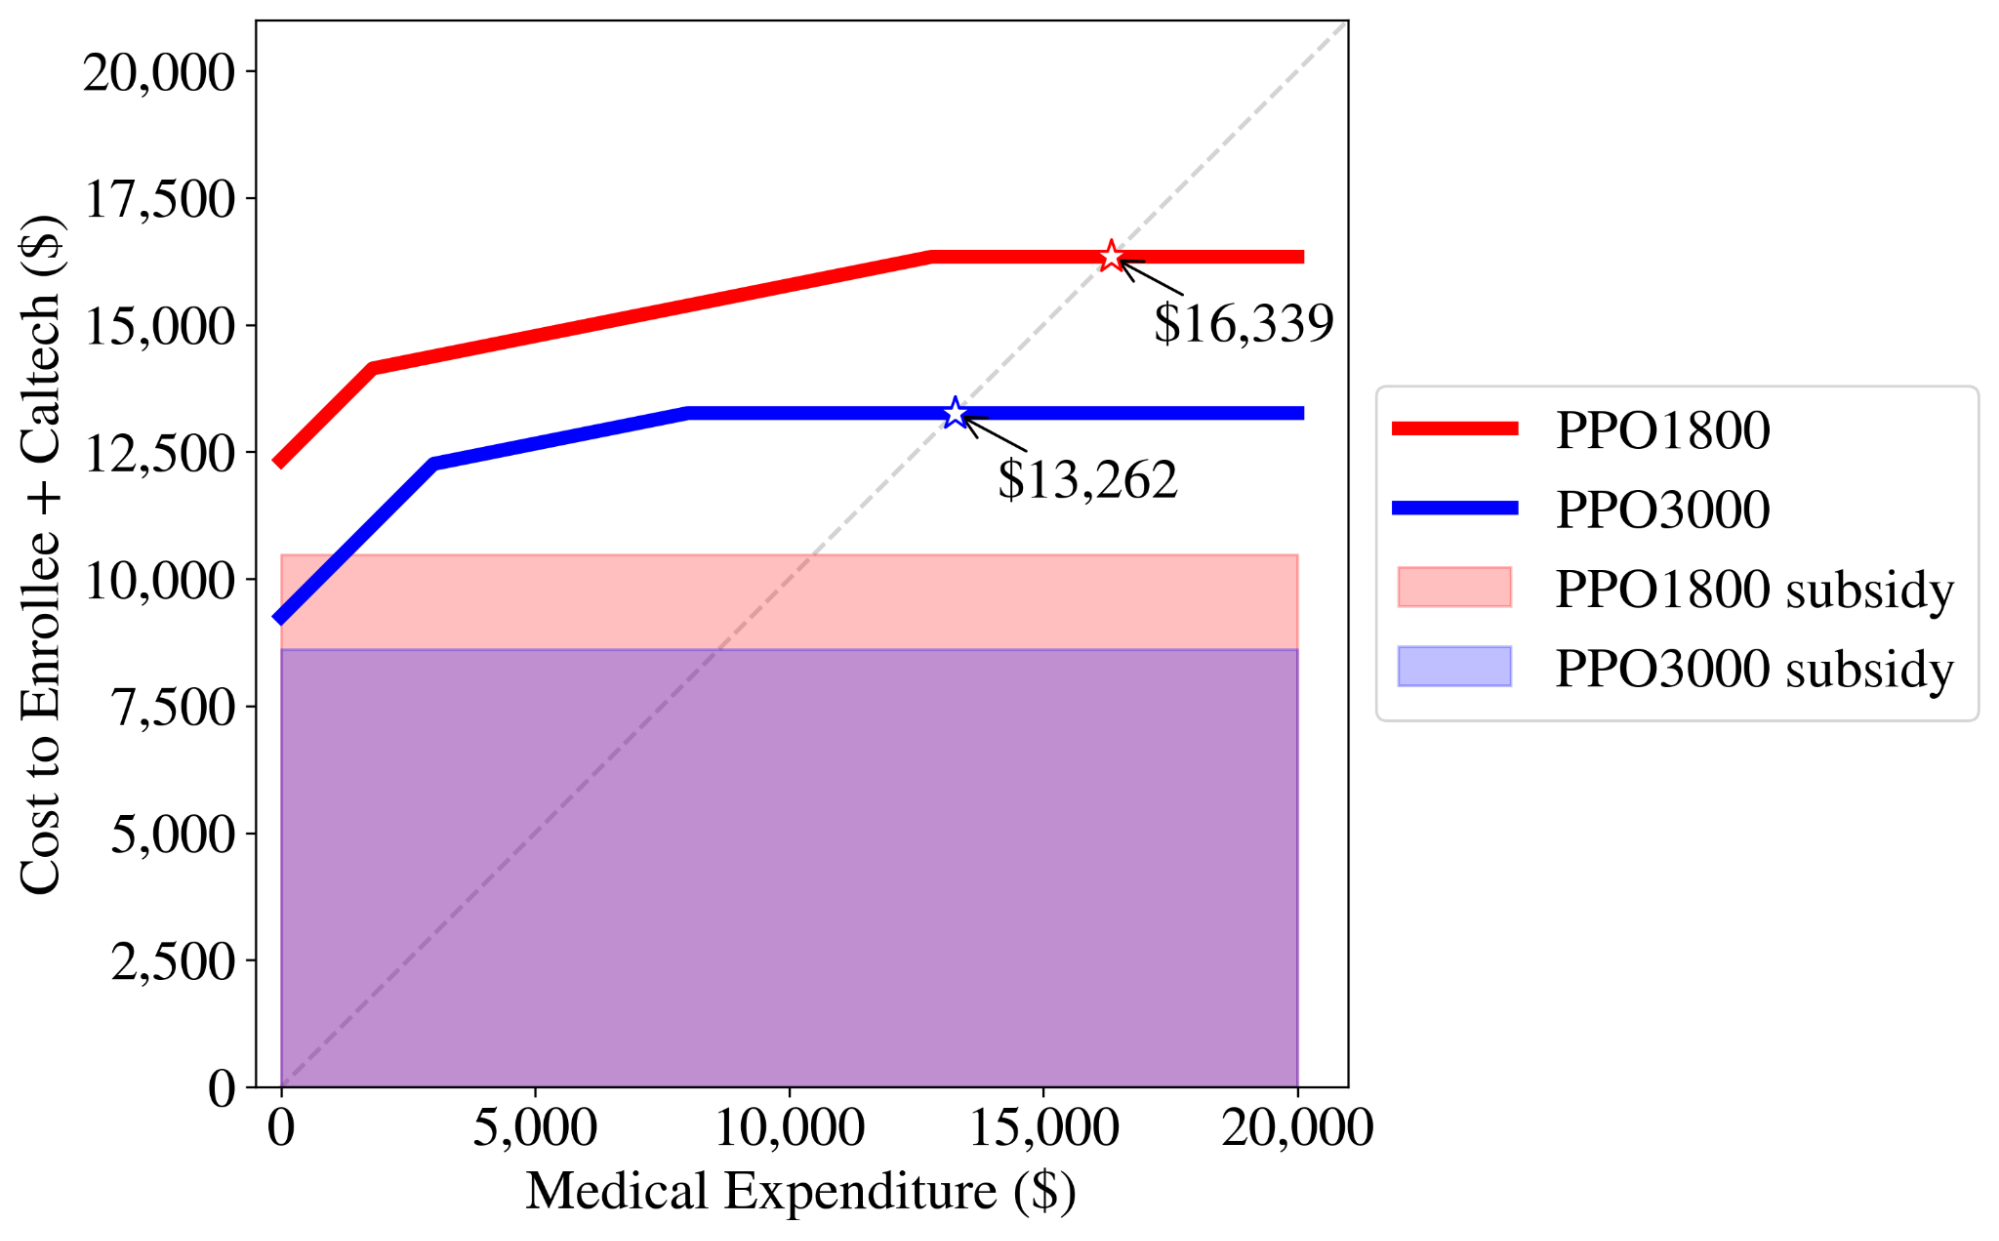
Figure 3: Healthcare costs. The cumulative cost paid by enrollees and Caltech for a given cost of healthcare as billed by service providers to Anthem for both Caltech-offered PPO plans.
When healthcare cost is above the diagonal dashed line, the insurance company makes a profit on an individual enrollee. The breakeven medical expenditure is $13,262 for the PPO 3000 plan, and $16,339 for the PPO 1800 plan.
There is no way of quantifying the total financial loss to Caltech and JPL staff, and to the Caltech administration, without knowing how many staff members are enrolled in the PPO 1800 plan. When contacted via email for enrollment statistics across the 2022 equivalent of the four plans listed in Table 1, Caltech HR declined to disclose this information, stating:
"When it comes to providing employee data to the public, it is against our Privacy Notice."
However, the Privacy Notice cited by Caltech HR is only applicable towards "Personal Information," defined as "any information that identifies or can be used to identify an individual," whereas this request was specifically for health insurance plan enrollment statistics, which clearly cannot identify nor be used to identify an individual. When this point was raised, Caltech HR once again declined to disclose this information, stating:
"The data you have requested is Caltech proprietary information. Caltech does not share this data except as needed to facilitate Caltech activities related to the administration of our benefits plan."
Without knowing how many staff members are electing the lower deductible PPO plan (PPO 1800, formerly PPO 1600), it is impossible to quantify the total financial loss to Caltech and its staff.
Meanwhile, federally mandated public disclosures can be found by searching Caltech's Federal Employer ID Number (EIN)"95-1643307" in the US Department of Labor Form 5500 Search page. The 2021 Consolidated Welfare Plan filed by Caltech earlier this year reveals total enrollees, claims charged, and claims paid. Forms filed since 2020 indicate that Anthem covered only 38-45% of charged claims since 2019, Table 4. Note that the average claims charged per enrollee exceeds the medical expenditures associated with the in-network OOPM in Figure 2a and Figure 3 for both PPO plans.
Table 4: Claims paid by Anthem. Total and average claims by Caltech staff across all Anthem healthcare plans over 2019-2021. This table was created by compiling costs from Form 5500 filed by Caltech for 2019-2021.
|
Year |
# Enrolled in Anthem Plans |
Total Claims Charged |
Total Claims Paid |
Avg. Claims Charged per Enrollee |
Avg. Claims Paid per Enrollee |
|
2021 |
2,690 |
$37,971,343 |
$17,103,284 (45%) |
$14,115.74 |
$6,358.10 |
|
2020 |
2,887 |
$39,009,867 |
$14,978,799 (38%) |
$13,512.25 |
$5,188.36 |
|
2019 |
3,179 |
$41,530,426 |
$17,510,035 (42%) |
$13,063.99 |
$5,508.03 |
Anthem data in Form 5500 Schedule A is consolidated over three plans (yearly equivalents of PPO 3000, PPO 1800, and HMO plans), making it impossible to determine the plan-specific enrollment numbers and therefore the exact financial loss to Caltech, or to determine the variation in claims paid between different PPO plans.
Caltech-offered health insurance plans PPO 1800 and PPO 3000 provide identical healthcare coverage, and can therefore be compared on the basis of financial considerations alone. Although the choice between the two plans is typically framed as either low deductibles with high premiums (PPO 1800) or high deductibles with low premiums (PPO 3000), the former is always more expensive than the latter, independent of medical expenditure. Once the tax-deductible nature of the premiums is considered (which the Caltech cost estimator tool does not account for), it is found that an enrollee could save up to $957 or lose up to $194 depending on their income level (and medical expenditure), by choosing the less expensive plan (PPO 3000). The potential savings outweigh the potential costs across all income levels, despite the fact that Caltech subsidizes the more expensive plan (PPO 1800) by an additional $1,865.28 per enrollee.
These calculations assume in-network coverage for a single employee. The differences between Anthem PPO plans would not decrease if out-of-network coverage and family coverage were to be considered. In the case of out-of-network providers, Anthem covers 60% rather than 80% for both PPO plans. In the case of family coverage, deductibles and OOPMs vary equivalently between the two plans. Furthermore, since premiums scale with individual rates (~2.1x for spouse/partner, ~2.4x for child(ren), and ~3.7x for family), the absolute cost differences between the two plans would be even greater than those reported above.
This analysis took time and effort that could otherwise have been spent on work, and raises more questions than answers. Is every Caltech and JPL staff member (postdocs, faculty, administrators, janitors, etc.) required to independently decipher these cost structures, meet with HR, and generate these plots on their own - or risk losing up to $957 (in the case of a postdoc)? Both Anthem PPO plans offer identical coverage, so why is the PPO 1800 plan objectively financially disadvantageous to enrollees across all income levels? How many Caltech and JPL staff members are enrolled in the more expensive plan - a statistic which Caltech HR has declined to disclose? How much money is lost annually by Caltech and JPL staff members who choose the more expensive PPO plan due to not understanding these cost structures? How much money is lost annually by the Caltech administration due to higher subsidies (additional $1,865.28 per enrollee) on the more expensive PPO plan? Why does Caltech incentivize the more expensive PPO plan by subsidizing it more, when both PPO plans offer identical coverage? How does Anthem's 38-45% aggregate coverage of charged claims vary between its three Caltech-offered PPO and HMO plans? On what basis were these PPO plan costs (premiums, deductibles, and OOPMs) determined by Anthem in the first place? The diversity of Caltech-offered Anthem PPO plans provides an illusion of choice, one of which (Anthem PPO 1800) effectively imposes an additional fee of up to $957 on its enrollees - and $1,865.28 on Caltech - due to not having taken the time to perform this analysis. It's clear that Anthem benefits from this system at the expense of Caltech and its staff.
Caltech offers consultations with HR specialists as well as an Anthem Concierge (who is employed by Anthem). After repeatedly raising concerns about the Anthem PPO 1600 plan to Caltech HR representatives directly via email and private meetings as far back as August 16, 2022, it came as a surprise that the costs of the 2023 PPO plans (Anthem PPO 3000 and Anthem PPO 1800) released on October 10 exacerbate the issues we raised (Figure 4).
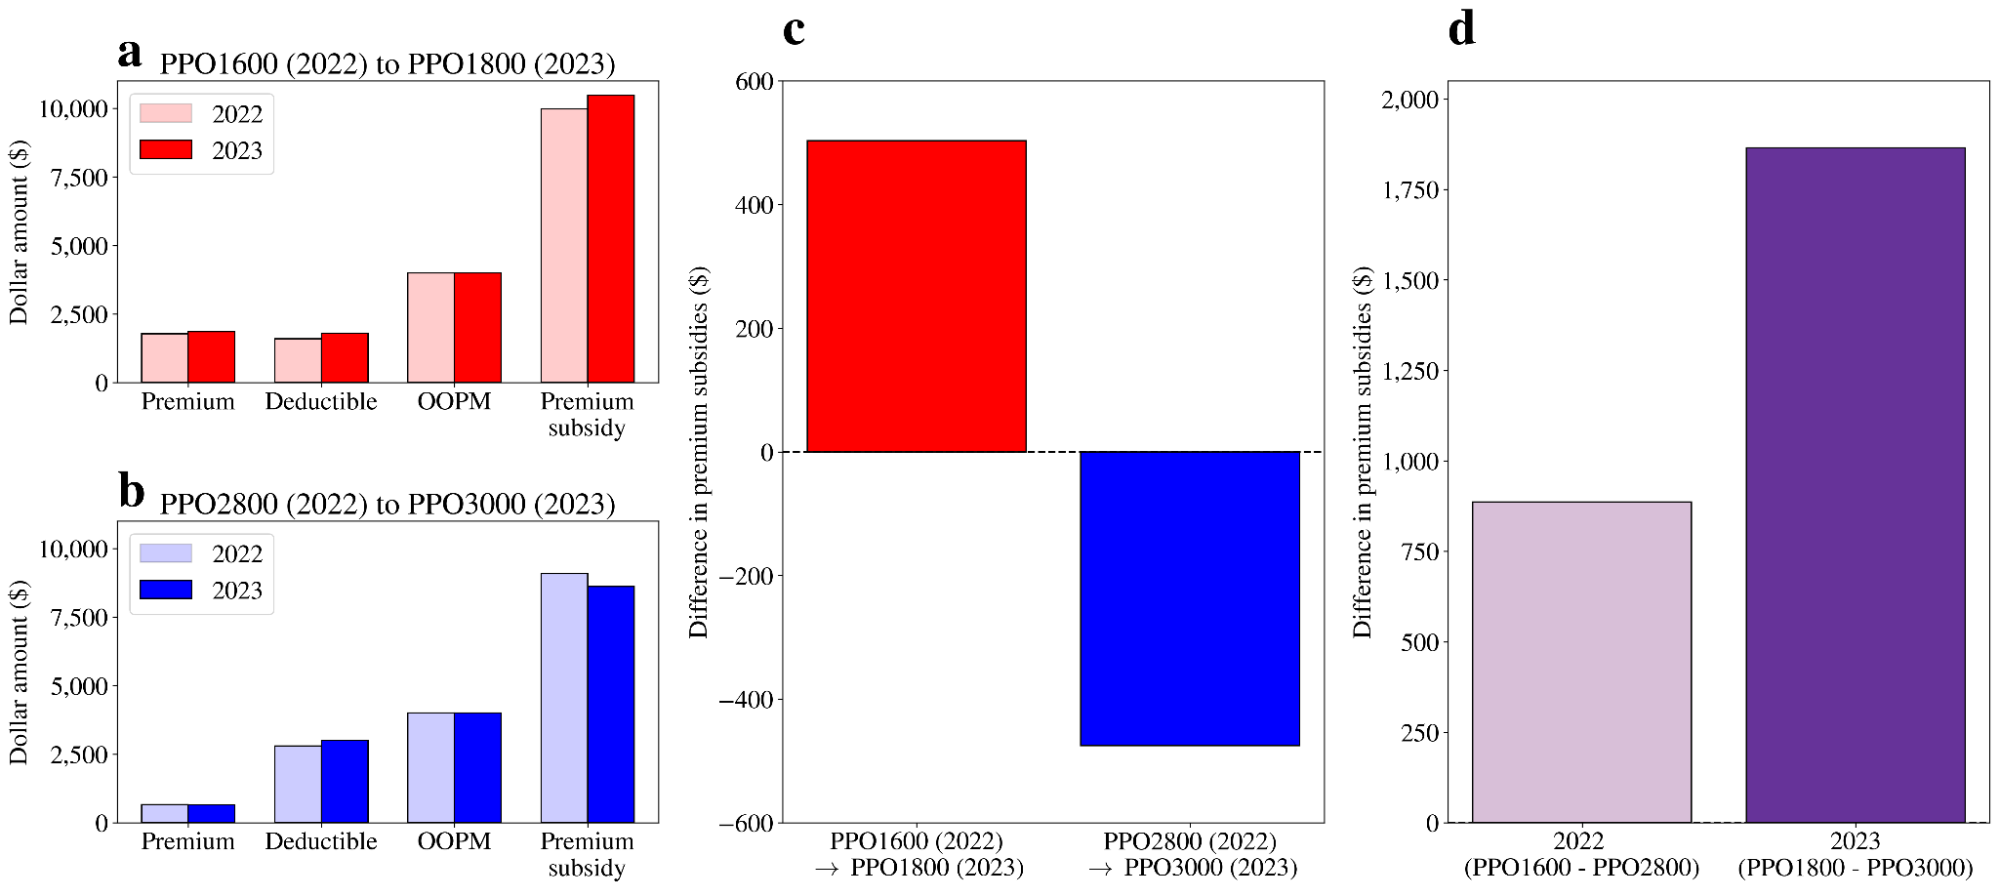
Figure 4: Year over year plan costs. Changes in Anthem PPO plan costs relative to previous year for the (a) lower deductible PPO plan (PPO 1800, formerly PPO 1600) and the (b) higher deductible PPO plan (PPO 3000, formerly PPO 2800). (c) Change in Caltech subsidies for each PPO plan. (d) Difference between Caltech subsidies for different PPO plans in each year.
Besides the salient $200 increase in deductible for each PPO plan, Caltech increased its subsidy for the more expensive plan (PPO 1800) by $503.52 and decreased its subsidy for the less expensive plan (PPO 3000) by $475.44 (Figure 4c), resulting in an additional $975.96 loss to Caltech for each employee who chooses the former, relative to the previous year. Even with this higher subsidy difference between PPO plans (Figure 4d), the lower deductible PPO plan is still more expensive to enrollees: whereas the potential savings of the higher deductible PPO plan already outweighed the potential costs across all income ranges in 2022, this difference is even more stark in 2023 (Table 2) due to the larger difference between enrollee premiums.
This article is a last resort to prevent Caltech and its staff from being further taken advantage of by Anthem. Anthem is a for-profit private health insurance company that is maximizing its profits at the expense of Caltech and its staff. The following actions can be taken to better understand and lessen the degree to which Anthem is unfairly extracting profits from Caltech:
Cost analysis
Disclosure of disaggregated data
Caltech subsidies
These actions would assist Caltech and JPL employees in making more informed healthcare plan decisions, thereby saving themselves and Caltech money every year. Equal subsidies would eliminate plan selection and employee compensation on the basis of subsidized cost.
This cost analysis is necessitated by the complexity of the U.S. health insurance system, which is often contrasted with the simplicity of the Canadian health insurance system. In Canada (or Spain, Italy, Sweden, the UK, or Japan, among other countries), single-payer healthcare systems are in place where consumers do not have to worry about networks, premiums, co-pays, deductibles or plan comparisons. Healthcare costs are automatically accounted for through taxes, and result in a significantly smaller fraction of GDP spent on healthcare than in the US. And whereas each of these countries have universal healthcare, more than 37 million Americans do not have any health insurance, resulting in 68,531 unnecessary deaths every year, as documented prior to the COVID-19 pandemic. A further 338,594 lives and $105 billion were lost during the pandemic as a result of incomplete insurance coverage in the US,as reported earlier this year. Efforts to pass a bill implementing a similar single-payer system in the US have failed at both the federal and state level, the latter as recently as this year, which politicalcommentators have attributed to political donations and lobbying from private for-profit healthcare providers. Earlier this year, Walker Bragman of The Lever reported the following:
The insurer Anthem and its affiliates have donated $78,000 to [California Governor Gavin] Newsom's campaigns since 2013, on top of $770,000 to the California Democratic Party since 2002. Anthem also gave $25,000 to Newsom's 2019 inaugural fund. Blue Shield and Anthem are both part of a coalition lobbying against the legislation, claiming it "would create a new and exorbitantly expensive government bureaucracy" and cause "significant job loss to California."
Anthem, Inc., which was renamed to Elevance Health, Inc. in June 2022, has a market cap of $117.07 billion as of October 19, 2022, and reported $6.21 billion in profits over the past year. This corporation, profiting off of insuring Caltech and JPL staff, bears responsibility for maintaining this needlessly complex and expensive system of private health insurance, hence necessitating this entire cost analysis in the first place.
All code, data, and methods can be found on https://github.com/sbooeshaghi/health-insurance
Thank you to Kayla Jackson, Maria Carilli, Lior Pachter, and Zaid Zayyad for insightful discussions that helped form the ideas presented here, and for feedback on the text.